Popular CFD Trading Strategies
1
Developing a successful strategy is critical for success in the world of CFD trading. Only by continually adapting and learning can an individual expect to develop profitability in this market. Detailed below are several such strategies and how to implement them.
Before discussing specific strategies, though, a few cautionary tips are warranted:
- Learn from your mistakes
- Think contrarian
- Minimize risk by diversification
- Continually monitor your portfolio with an eye toward rebalancing
- Normalize your expectations
The Trend is your friend
Trend following is an effective strategy in trading markets to generate profits. Trends have two easily identifiable scenarios that lend themselves to trading activity: the Crossover strategy and the Breakout strategy.
By the way, the profitability of these strategies was tested on the trading platforms of FBS and Roboforex. They will give you free forex bonus after registration, which you may use for trading or strategy testing.
The Crossover trend following the trading strategy is a variation on the trading truism: Better to be late to a party than early. The default method of testing when trends are sufficiently sustainable and appropriate for small traders is to look at and compare the values and trends of moving averages of different lengths.
A popular set for comparison is the 9 and 21-period Exponential Moving Averages (EMAs). These 2 EMA crossovers will give the trend direction of the market price. This simple strategy can be used in a variety of situations, but if there is no trend, it may generate false signals.
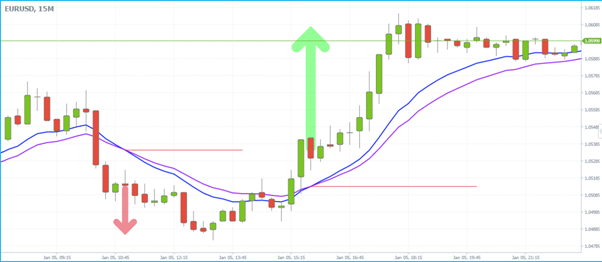
- Buy Rules — With the market in a strong upward movement, when the 9-period EMA crosses over from below to above the 21-period EMA and the price is above both, then initiate buy orders. Repeat this procedure anew with each pullback from both EMAs. Close your position with a profit when the short EMA re-crosses the long EMA from above in a downward direction.
- Sell Rules — With the market in a strong downward trend, when the 9-period EMA crosses over from above to below the 21-period EMA and the price is below both then initiate sell orders. Repeat this procedure anew with each movement upward from both EMAs. Close your position with a profit when the short EMA re-crosses the long EMA from below in an upward direction.
A profitable buy trading scenario is demonstrated in the following graph:
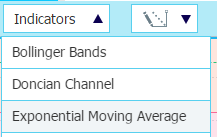
To implement this strategy on the Tickmill Web Trader. In the expanded performance graph (![]() ):
):
1. Click Indicators and select Exponential Moving Average
2. In the displayed Dialog, define length as “9” (and repeat the procedure for “21)
3. Customize the line colors by selecting a line node (![]() ) and using the pencil icon (
) and using the pencil icon (![]() ).
).
4. Change the EMA length by using the gear icon (![]() ).
).
Another usage of trend in developing a trading strategy is to recognize when a trend has entered a second (or third) phase and breakouts of resistance and support levels have occurred. The analysis is usually based on a Fibonacci retracement, a concept in which mathematical relationships between numbers in a sequence appear frequently in the natural world.
The retracement trade is initiated after MISSING the trend’s significant, generally more profitable first phase and is more appropriate for experienced and cold-blooded traders who know the specific market.
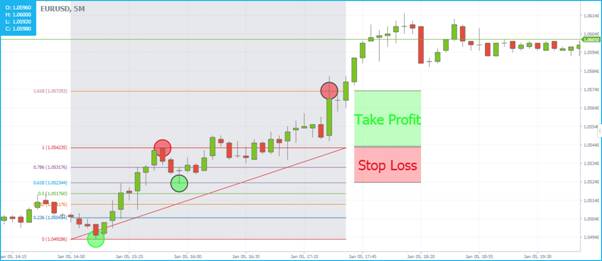
Nevertheless, this strategy is measured in a progressive sequence of three critical points, which we will call X, Y, and Z:
- Buy Rule — A solid upward trend starts at moment (point) X. Y represents the point at which resistance forces the trend line into retracement. When the price trend reversal halts at Z (some 38% – 50% below the increase from X to Y), a buy entry point is set when the Y level is breached on the return upwards. Set your profit stop at Z points above your entry level.
- Sell Rule — A solid downward movement starts at moment (point) X. Y represents the point at which support forces the trend line into upward movement. When the price trend reversal halts at Z (some 38% – 50% above the increase from X to Y), a sell entry point is set when the Y level is breached on the return downwards. Set your profit stop at Z points below your entry level.
The buy example is illustrated below:
To implement this strategy on the Tickmill Web Trader:
1. Click the charting icon ![]()
2. In the drop-down listing, select Fib Retracement:
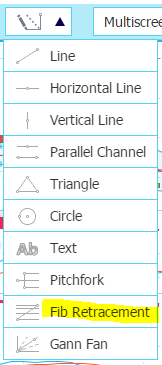
3. From a specific level, click and hold the cursor to draw the hypotenuse of a triangle that covers the range of activity. The Fibonacci retracement levels are displayed.